Project Summary and Skills Used
For our computing II Final project, we built an interactive job-search that assist users in finding suitable jobs in the United States. We saw a gap in the market because job searches like Indeed simply have you give your location and they find jobs near that location. However, with today’s job market many people do not have the luxury of finding a job where they already live so we gave them the option to explore lotions throughout the United States that have jobs that match their skills. Our program allows users rate how important salary, distance, and how close a certain job is to their desired job. They then insert their experience and desired job with a description of what their perfect job looks like. Our project works by embedding each job description into a 1024-dimensional vector using a sentence transformer model (BGE-3) and computes cosine similarity between the user’s description and each job posting. We are able to take our user’s inputs and display a Vaadin map that shows clusters of where the hot-spots are for their preferred types of jobs, and after a they select a cluster our program will rank the jobs in that cluster according to the users inputs.
This project incorporates several engineering concepts, such as multi-criteria decision making, data processing, machine learning-based text embedding, K-means clustering for geographic visualization. We use all of these industrial engineering concepts to create an easy to use tool that is able to create optimal outcomes for the user while keeping a focus on real world application.
Key skills used during the project
- Vaadin skills to make a reliable and simple to use interface
- Object-oriented programming in Java
- AI integration and text embedding
- K-means clustering using SMILE’s machine learning library
- Teamwork and communication skills between team members
Project Development Process
Our project started with a fairly simple idea: create a job selector that let users choose a few criteria and see which jobs matched. Once we began planning, we realized how we could take it a step above. This led us to expand the project far beyond basic filtering and into a full recommendation system that used AI-generated job descriptions, vector embeddings, clustering, and an interactive map. As the design evolved, our development process started to feel like a complete pipeline with multiple stages. Data moved through several formats CSV, Parquet, and NPY as it traveled between Python and Java. Python handled the AI generation and similarity scoring, while Java dealt with filtering, clustering, and the user interface. Keeping everything consistent between these two languages was one of the biggest parts of the project, and it taught us a lot about how real systems pass data across different tools. We ran into several challenges along the way. One of the first was making sure our fit-score model calculated everything correctly. We had to align similarity values, salary scaling, location preferences, and user-chosen weights so that both Python and Java treated the data the same way. Another major challenge was getting the map to work the way we wanted. Missing latitude/longitude columns, layout issues, and clustering mismatches caused the map to fail multiple times. Fixing these problems required stepping back and making sure every stage of the data pipeline was working as intended. By the end, the final system met and surpassed what we had originally pictured. Seeing all the different components finally connect was extremely rewarding. What started as a simple idea grew into a full AI-supported recommendation tool, and the development process gave us valuable experience working with multiple technologies, debugging larger systems, and building a complete application from start to finish.
Key Features or Highlights
This project was particularly difficult to fit all the different pieces together. We were using tons of different libraries all with different syntax conventions. Seeing all the integration work together was very gratifying. We used intermediaries like csv, parquet, npy to create snapshots of our work and files. Every step of the process this single data was sent through so many different channels. It was sort of like an assembly line. In the real world with hundreds of systems working simultaneously this experience was very practical. A flow chart of this sequence is shown below to visualize our work and how all the AI work ends up back to the jobs for fit score. 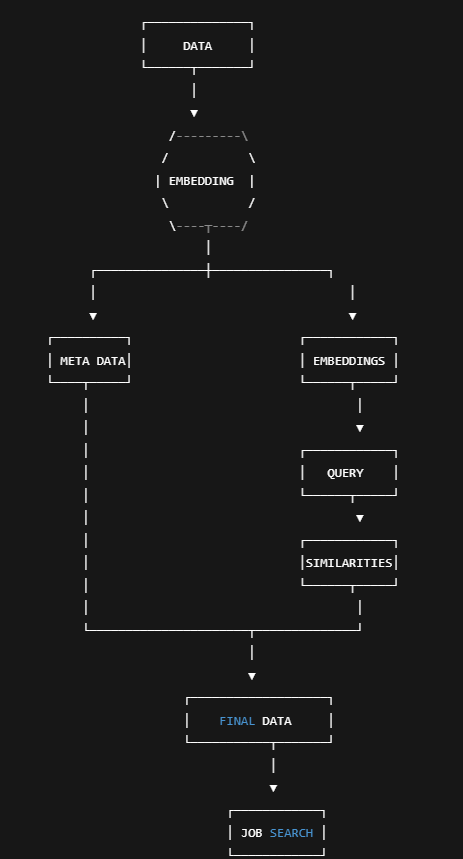
Another part we were proud of was the data generation aspect. It was exhausting and took around 50 hours to generate but was an eye opening experience to the possibilities of AI. Our functionality went through each line and providing the AI only a job title, company description, and salary to write a 200 word job description. We were able to mess with the model parameters, something you can’t do from the main user interface on AI programs using python, which allowed us to use a lightweight model tailored to creative writing for speed. We changed the temperature which influences how random the generation is to make similar inputs create drastically different outputs. Moreover it allowed checkpoints to be saved along the way so we could start and stop. Code snippets are shown below Function to build prompt: 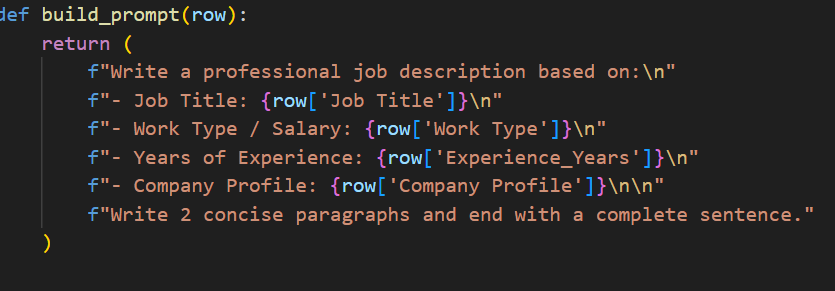
Runs the function with dataframe row, runs model, checks to make sure generation finished sentence and didn’t cut off, and added back result to generated description column 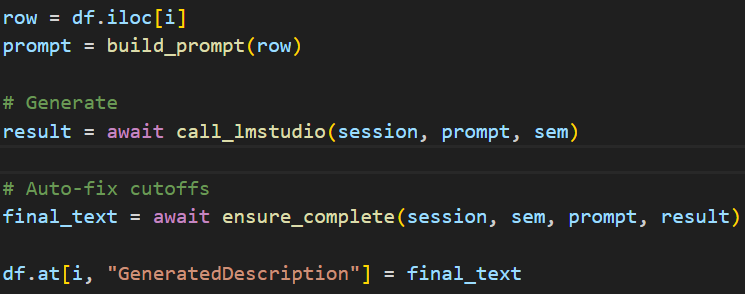
Finally the culmination of our project which was this final calculation showed the weaving of so many different working parts to get this ultimate output. It took the fit score from the program above, the salary score standardized relative to the job market for its relative benchmark, and the location score which evaluated whether the job was in the user’s desired cluster, picked from our complex clustering map. Finally it incorporated the user input which were weights on these scores to account for their preferences. It did this for every row to find the best overall jobs.  The code snippets above demonstrated the complex nexus of so many components all to come together to provide professional job recommendations. Thousands of computations all working in the background to come together for a common purpose.
Reflection
My main contribution in this project was implementing K-means clustering and integrating it into our project using Vaadin maps. I was responsible for doing research to find the best type of clustering to use for our map and how to best integrate that into our project. I tested different values of k to adjust the number of clusters that would make sense geographically for our users. Through this project I learned how to effectively integrate clustering into a project and how to use vaadin maps to create a effective UI tool. The main lessons I learned while doing this project was how to find an answer that was not to taught in class using trial and error and how to communicate with a group effectively so that everyone is on the same page and we can all weigh our input on problems that arise.